
 MyFxTops邁投財經
1. 概述
如果您曾经尝试过创建或修改复杂指标,您也许知晓缓冲区数量增加时出现的一些问题:您需要为缓冲区声明大量的双精度数组,将它们设置为缓冲区,为它们进行配置…
随之而来的是作图板:您必须声明您正在使用的作图板类型,为其配置所有属性,然后确保一切正确,并且您已声明正确数量的缓冲区和作图板(如果少了,那么您将得到数组超界错误,或不可见的作图板, 直到您注意到问题)。
最后而来的是处置缓冲区的数据:如果您打算将来自大量缓冲区的数据合并(例如,取 10 个缓冲区的平均/最大/最小值,合并为一),那么您需要编写冗长的重复代码行逐个比较/组合每个缓冲区,或者依靠一些聪明的小技巧,利用宏替换或函数来节省一些空间。 结果大概是一样的:大量代码行和重复功能,非常复杂和混乱,极易出现漏洞。 如果您在任何地方犯了疏漏,那么检测并纠正它将是一场噩梦!
当制作复杂的指标时,无论是功能或视觉,这类情况都会对初学者(甚至高级程序员)造成障碍。 然而,有一个小技巧并不是每个人都清楚,它可以令您的指标编码更快捷、更容易:
您可以将对象内部包含的数组设置为缓冲区
在本文中,我们将探讨此技巧能为我们提供的选项,及随之而来的解决方案,从而能够运用面向对象编程将此技巧应用于任何其它情况。
2. 第一个例子
在我们开始制作指标之前,我们先看看包含缓冲区数组的对象,其最基本形式是什么样子的:
class CIndicatorPlot { public: double array[]; };
它只有一个公开数组。 至于目前,重要的是它是公开的,如此我们就可以在将其设置为缓冲区,或设置/访问它拥有的数据(与任何其它指标一样)。
现在我们来处置指标:为了应用一些概念,我们将创建一个指标,该指标显示 10 个具有不同周期和平均值的 RSI。 我们将从属性、输入、和 OnInit 函数开始。
#property indicator_buffers 11 #property indicator_plots 11 input int firstPeriod = 6; input int increment = 2; CIndicatorPlot indicators[]; int handles[]; //+------------------------------------------------------------------+ //| Custom indicator initialization function | //+------------------------------------------------------------------+ int OnInit() { ArrayResize(indicators, 11); //--- indicator buffers mapping for (int i=0; i<11; i++) { SetIndexBuffer(i, indicators[i].array, INDICATOR_DATA); PlotIndexSetInteger(i, PLOT_DRAW_TYPE, DRAW_LINE); } for (int i=0; i<10; i++) PlotIndexSetInteger(i, PLOT_LINE_COLOR, clrRed); PlotIndexSetInteger(10, PLOT_LINE_COLOR, clrCyan); PlotIndexSetInteger(10, PLOT_LINE_STYLE, STYLE_DASH); PlotIndexSetInteger(10, PLOT_LINE_WIDTH, 2); ArrayResize(handles, 10); for (int i=0; i<10; i++) handles[i] = iRSI(NULL, PERIOD_CURRENT, firstPeriod+i*increment, PRICE_CLOSE); //--- return(INIT_SUCCEEDED); }
请注意,我们只用到了 2 个属性:indicator_buffers 和 indicator_plots。 除了共用的(版权,链接,版本,单独/图表窗口……)之外,始终需要这两个。 其它属性(线条颜色、绘制类型…)都是可选的,但为了令代码更紧凑,我们将在循环中利用 PlotIndexSetInteger 配置它们。对于该指标,我们需要为每个拥有不同周期的 RSI 提供 10 个缓冲区,还需要一个额外缓冲区保存它们的平均值。 我们将所有这些放在一个数组当中。 此外,我们还要在 OnInit 中创建指标的句柄。
现在,少量计算和数据复制…
//+------------------------------------------------------------------+ //| Custom indicator iteration function | //+------------------------------------------------------------------+ int OnCalculate(const int rates_total, const int prev_calculated, const datetime &time[], const double &open[], const double &high[], const double &low[], const double &close[], const long &tick_volume[], const long &volume[], const int &spread[]) { //--- int limit = MathMax(0, prev_calculated-1); for (int i=0; i<10; i++) { if (limit==0) CopyBuffer(handles[i], 0, 0, rates_total-limit, indicators[i].array); else { double newValues[]; CopyBuffer(handles[i], 0, 0, rates_total-limit, newValues); for (int k=0; k<rates_total-limit; k++) { indicators[i].array[limit+k] = newValues[k]; } } } for (int i=limit; i<rates_total; i++) { indicators[10].array[i] = 0.0; for (int j=0; j<10; j++) indicators[10].array[i] +=indicators[j].array[i]; indicators[10].array[i]/=10.0; } //--- return value of prev_calculated for next call return(rates_total); }
请注意,计算来自所有缓冲区的平均值,现在就像执行循环一样简单。 如果每个缓冲区都是在全局范围内都声明为双精度数组(像往常一样),那么它们相加则不那么容易,或难以在少量代码行内完成。
最后,不要忘记释放指标句柄…
//+------------------------------------------------------------------+ //| Custom indicator deinitialization function | //+------------------------------------------------------------------+ void OnDeinit(const int reason) { for (int i=0; i<10; i++) IndicatorRelease(handles[i]); } //+------------------------------------------------------------------+
这是我们的最终结果:
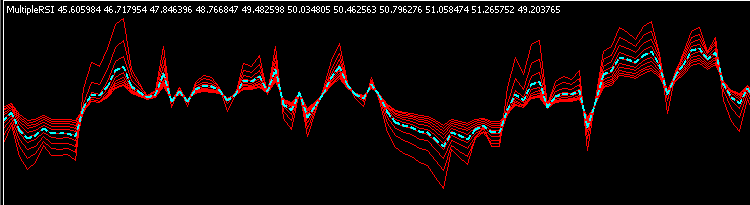
对于代码的长度来说还不错,但是正如我们将在下一章节中将看到的那样,它仍然有一些改进的空间。
3. 添加更多选项
尽管该类在初始化阶段配置属性(而不是 #property)时为我们节省了一些空间,但我们仍然必须手工配置缓冲区和作图板,而且每次都如此并非很简单。 难道没有更有效的方法吗?答案是肯定的,我们通过向类委派功能来实现这一点。 答案是肯定的,我们能依靠向类委派功能来做到这一点。
首先,我们将往类中添加一些稍后需要的附加函数。
class CIndicatorPlot { private: int indicator_plot; public: double array[]; void SetBuffer(int &buffer, int &plot); void SetLineWidth(int width); void SetLineStyle(ENUM_LINE_STYLE style); void SetLineColor(color line_color); void SetLabel(string label); };
SetBuffer 函数设置指标缓冲区和作图板。 通过引用传递的两个变量,若一个对象改变了它们的值,则会反映在其它对象下一次对它们的调用中。 保存作图板索引,以便设置其它属性。
其余的设置函数是简单的作图板属性设置器。
//+------------------------------------------------------------------+ void CIndicatorPlot::SetBuffer(int &buffer,int &plot) { indicator_plot = plot; SetIndexBuffer(buffer, array, INDICATOR_DATA); PlotIndexSetInteger(indicator_plot, PLOT_DRAW_TYPE, DRAW_LINE); buffer++; //Increment for other steps (One buffer in this case) plot++; //Increment one plot in any case } //+------------------------------------------------------------------+ void CIndicatorPlot::SetLineWidth(int width) { PlotIndexSetInteger(indicator_plot, PLOT_LINE_WIDTH, width); } //--- //...
为了帮助在指标中添加一些视觉趣味,我们还将创建一个插值颜色函数,稍后我们将用到它:
//+------------------------------------------------------------------+ //| Function to linearly interpolate 2 colors | //+------------------------------------------------------------------+ color InterpolateColors(color colorA, color colorB, double factor) { if (factor<=0.0) return colorA; if (factor>=1.0) return colorB; int result = 0; for (int i=0; i<3; i++) //R-G-B { int subcolor = int( ((colorA>>(8*i))&(0xFF))*(1.0-factor) + ((colorB>>(8*i))&(0xFF))*factor ); subcolor = subcolor>0xFF?0xFF:( subcolor<0x00?0x00: subcolor); result |= subcolor<<(8*i); } return (color)result; }
现在,OnInit 函数的模样如此:
CIndicatorPlot* indicators[]; CIndicatorPlot average; int handles[]; //+------------------------------------------------------------------+ //| Custom indicator initialization function | //+------------------------------------------------------------------+ int OnInit() { //--- indicator buffers mapping ArrayResize(indicators, 10); ArrayResize(handles, 10); int index=0, plot=0; for (int i=0; i<10; i++) { indicators[i] = new CIndicatorPlot(); indicators[i].SetBuffer(index, plot); indicators[i].SetLineColor(InterpolateColors(clrYellow, clrRed, i/9.0)); indicators[i].SetLabel("RSI ("+IntegerToString(firstPeriod+i*increment)+")"); handles[i] = iRSI(NULL, PERIOD_CURRENT, firstPeriod+i*increment, PRICE_CLOSE); } average.SetBuffer(index, plot); average.SetLineColor(clrBlue); average.SetLineStyle(STYLE_DASH); average.SetLineWidth(2); average.SetLabel("Average"); //--- return(INIT_SUCCEEDED); }
请注意,我们未在任何地方通过编号来引用任何缓冲区或作图板:由类来处理该问题。 现在,很容易就能正确设置任何作图板属性,或更改缓冲区的顺序,因为我们可以按对象来引用它们,替代索引。 我们还借机为作图板添加了一些颜色和标签。
在这个例子中,我们还用 RSI 的指针数组修改指标结构(亦证明也可用于动态创建的对象),并从数组中将平均值分离。 有因于此,我们需要修改 OnCalculate 中的平均值引用,并在 OnDeInit 中删除指针数组中的指标。
void OnDeinit(const int reason) { for (int i=0; i<10; i++) IndicatorRelease(handles[i]); for (int i=0; i<10; i++) delete indicators[i]; }
现在它看起来像这样:
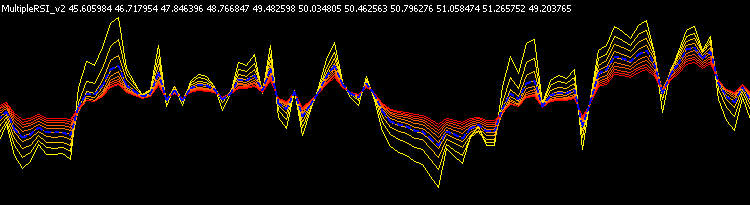
唯一的视觉变化是颜色(以及数据窗口中的标签)。 在内里,我们通过简化处置作图板和缓冲区来改进工作流程,但其组织内部依旧还有很大的改进空间。
如果您仔细观察,就会发现每个句柄只由其中一个缓冲区使用:每个 RSI 缓冲区都可以独立计算,因此我们可以让类在内部执行此操作(替代直接在 OnCalculate 中进行计算)。 均化需要访问其余缓冲区,但这些计算也可以委托给类。 我们可以使用继承来添加特定功能,而无需更改函数,或在基类中添加条件。
首先,我们将虚拟的空白事件处理程序添加到基类之中:
class CIndicatorPlot { //... public: //... virtual void Init() { } virtual void DeInit() { } virtual void Update(const int start, const int rates_total) { } };
正如此例之前所示,Update 只需要 start 和 rates_total 即可执行计算,因此其余值可被省略。
现在我们制作单独的 RSI 类。 它可以创建和删除所需的句柄。 此外,我们包含了一个函数来设置该句柄的周期,但它也可以将该参数包含在 Init() 当中。
class CRSIIndividual : public CIndicatorPlot { private: int handle; int rsi_period; public: void SetPeriodRSI(int period); virtual void Init(); virtual void DeInit(); virtual void Update(const int start, const int rates_total); }; //+------------------------------------------------------------------+ void CRSIIndividual::SetPeriodRSI(int period) { rsi_period = period; } //+------------------------------------------------------------------+ void CRSIIndividual::Init(void) { handle = iRSI(NULL, PERIOD_CURRENT, rsi_period, PRICE_CLOSE); } //+------------------------------------------------------------------+ void CRSIIndividual::Update(const int start,const int rates_total) { if (start==0) CopyBuffer(handle, 0, 0, rates_total-start, array); else { double newValues[]; CopyBuffer(handle, 0, 0, rates_total-start, newValues); for (int k=0; k<rates_total-start; k++) { array[start+k] = newValues[k]; } } } //+------------------------------------------------------------------+ void CRSIIndividual::DeInit(void) { IndicatorRelease(handle); }
对于 Average 类,我们需要存储指针,以便访问指标作图板对象的其余部分(单独的 RSI)。 在此情况下,Init() 和 DeInit() 就不需要了。
class CRSIAverage : public CIndicatorPlot { private: CRSIIndividual* rsi_indicators[]; public: void SetRSIPointers(const CRSIIndividual &rsi_objects[]); virtual void Update(const int start, const int rates_total); }; //+------------------------------------------------------------------+ void CRSIAverage::SetRSIPointers(const CRSIIndividual &rsi_objects[]) { int total = ArraySize(rsi_objects); ArrayResize(rsi_indicators, total); for (int i=0; i<total; i++) rsi_indicators[i] = (CRSIIndividual*)GetPointer(rsi_objects[i]); } //+------------------------------------------------------------------+ void CRSIAverage::Update(const int start,const int rates_total) { for (int i=start; i<rates_total; i++) { array[i] = 0.0; for (int j=0; j<10; j++) array[i] +=rsi_indicators[j].array[i]; array[i]/=10.0; } }
若您可以直接从全局范围访问对象时,创建指针数组可能会令问题过于复杂,但如此这般其它指标重用该类就变得更加容易,且无需进行更多修改。 另请注意,在此示例中,我们将再次使用对象数组,替代 RSI 指标指针,因此我们需要获取它们的指针。
最后,OnInit 函数(以及上面的对象声明)将如下所示…
CRSIIndividual indicators[]; CRSIAverage average; //+------------------------------------------------------------------+ //| Custom indicator initialization function | //+------------------------------------------------------------------+ int OnInit() { //--- indicator buffers mapping ArrayResize(indicators, 10); int index=0, plot=0; for (int i=0; i<10; i++) { indicators[i].SetBuffer(index, plot); indicators[i].SetLineColor(InterpolateColors(clrYellow, clrRed, i/9.0)); indicators[i].SetLabel("RSI ("+IntegerToString(firstPeriod+i*increment)+")"); indicators[i].SetPeriodRSI(firstPeriod+i*increment); indicators[i].Init(); } average.SetBuffer(index, plot); average.SetLineColor(clrBlue); average.SetLineStyle(STYLE_DASH); average.SetLineWidth(2); average.SetLabel("Average"); average.SetRSIPointers(indicators); //--- return(INIT_SUCCEEDED); }
…我们将能够令其它事件处理函数更加干净:
//+------------------------------------------------------------------+ //| Custom indicator iteration function | //+------------------------------------------------------------------+ int OnCalculate(const int rates_total, const int prev_calculated, const datetime &time[], const double &open[], const double &high[], const double &low[], const double &close[], const long &tick_volume[], const long &volume[], const int &spread[]) { //--- int limit = MathMax(0, prev_calculated-1); for (int i=0; i<10; i++) indicators[i].Update(limit, rates_total); average.Update(limit, rates_total); //--- return value of prev_calculated for next call return(rates_total); } //+------------------------------------------------------------------+ //| Custom indicator deinitialization function | //+------------------------------------------------------------------+ void OnDeinit(const int reason) { for (int i=0; i<10; i++) indicators[i].DeInit(); } //+------------------------------------------------------------------+
直观来看,该指标与第二个示例完全相同。
4. 扩展类
截至目前,所有这些类都能很好地完成它们的工作,但它们特别依赖于我们一直在处置的指标类型:我们仅用了少数的作图板属性,并且仅用了折线图,但如果我想用具有颜色缓冲区的作图板该怎么办? 或是直方图,或是之字形…? 为了能够重用我们已完成的工作,我们需要泛化该类。 为此,我们需要满足三个条件:
- 您应该能够创建任何类型的作图板/缓冲区,或修改作图板属性,而无需离开类,或了解缓冲区/作图板索引的详细信息。
- 您应该能够添加具有任何绘制样式(折线、直方图、蜡烛…)的作图板,而不必担心与之对应的缓冲区数量和类型(不过,您应始终负责把数据放入这些数组之中)。
- 您应该能够通过继承(可选)轻松地向类添加特定功能。
考虑到这一点,我们将首先解释类是如何实现的,以及继承是如何构建的。
首先,类的结构如下:
- CIndicatorBufferBase
- CIndicatorCalculations
- CIndicatorPlotBase
- CIndicator_1Data
- CIndicatorPlotLine
- CIndicatorPlotHistogram
- …
- CIndicator_1Data1Color
- CIndicatorPlotColorLine
- …
- CIndicator_2Data
- CIndicatorPlotHistogram2
- …
- CIndicator_2Data1Color
- CIndicatorPlotColorHistogram2
- …
- CIndicator_4Data
- CIndicatorPlotCandles
- …
- CIndicator_4Data1Color
- CIndicatorPlotColorCandles
- …
几个关键点:
- 这三个点表示有更多的类继承自与上面的类相同的类(它们仅在绘制样式上有所不同,这是每个类所隐含的)。
- 红色的类是无法实例化的抽象类,但它们可以存储从它们派生的其它类的指针(多态性)。
- 其余类继承自拥有相应数据/颜色缓冲区数量的基类。 这也允许多态性,因为您可能有一个指标需要访问拥有 1 个数据缓冲区的类,它与是否折线、直方图、等等无关。
- 颜色类继承自数据缓冲区的原因与上点相同。
- CIndicatorCalculations 是辅助计算缓冲区,它没有对应的作图板。
实现汇总如下所示:
//+------------------------------------------------------------------+ //| Base class for plots and calculation buffers | //+------------------------------------------------------------------+ class CIndicatorBufferBase { public: virtual void SetBuffer(int &buffer, int &plot)=NULL; virtual void SetAsSeries(bool set)=NULL; virtual void Init() { } virtual void DeInit() { } virtual void Update(const int rates_total, const int prev_calculated, const datetime &time[], const double &open[], const double &high[], const double &low[], const double &close[], const long &tick_volume[], const long &volume[], const int &spread[]) { } }; //+------------------------------------------------------------------+ //| Calculations Buffer (with no plot) | //+------------------------------------------------------------------+ class CIndicatorCalculations : public CIndicatorBufferBase { public: double array[]; virtual void SetBuffer(int &buffer, int &plot); virtual void SetAsSeries(bool set); }; //+------------------------------------------------------------------+ void CIndicatorCalculations::SetBuffer(int &index, int &plot) { SetIndexBuffer(index, array, INDICATOR_CALCULATIONS); index++; //No plot is used } //+------------------------------------------------------------------+ void CIndicatorCalculations::SetAsSeries(bool set) { ArraySetAsSeries(array, set); } //+------------------------------------------------------------------+ //| Base indicator plot class | //+------------------------------------------------------------------+ class CIndicatorPlotBase : public CIndicatorBufferBase { protected: int indicator_plot; virtual void SetDrawType()=NULL; //Implicit in each class public: void SetArrow(uchar arrow); void SetArrowShift(int shift); void SetDrawBegin(int begin); void SetShowData(bool show); void SetShift(int shift); void SetLineStyle(ENUM_LINE_STYLE style); void SetLineWidth(int width); void SetColorIndexes(color &color_array[]); void SetLineColor(color line_color); void SetLineColor(color line_color, int index); void SetEmptyValue(double empty); void SetLabel(string label); int GetInteger(ENUM_PLOT_PROPERTY_INTEGER property_id, int property_modifier=0); }; //... //... //+------------------------------------------------------------------+ //| Base for indicators with 1 Data Buffer | //+------------------------------------------------------------------+ class CIndicator_1Data : public CIndicatorPlotBase { public: double array[]; virtual void SetBuffer(int &buffer, int &plot); virtual void SetAsSeries(bool set); }; //+------------------------------------------------------------------+ void CIndicator_1Data::SetBuffer(int &buffer,int &plot) { indicator_plot = plot; SetIndexBuffer(buffer, array, INDICATOR_DATA); SetDrawType(); buffer++; plot++; } //... //+------------------------------------------------------------------+ //| Plot Line (1 data buffer) | //+------------------------------------------------------------------+ class CIndicatorPlotLine : public CIndicator_1Data { protected: virtual void SetDrawType() final; }; //+------------------------------------------------------------------+ void CIndicatorPlotLine::SetDrawType(void) { PlotIndexSetInteger(indicator_plot, PLOT_DRAW_TYPE, DRAW_LINE); } //... //... //+------------------------------------------------------------------+ //| Base for indicators with 2 Data Buffers | //+------------------------------------------------------------------+ class CIndicator_2Data : public CIndicatorPlotBase { public: double first_array[]; double second_array[]; virtual void SetBuffer(int &buffer, int &plot); virtual void SetAsSeries(bool set); }; //+------------------------------------------------------------------+ void CIndicator_2Data::SetBuffer(int &buffer, int &plot) { indicator_plot = plot; SetIndexBuffer(buffer, first_array, INDICATOR_DATA); SetIndexBuffer(buffer+1, second_array, INDICATOR_DATA); SetDrawType(); buffer+=2; plot++; } //... //... //+------------------------------------------------------------------+ //| Base for indicators with 1 Data Buffer & 1 Color Buffer | //+------------------------------------------------------------------+ class CIndicator_1Data1Color : public CIndicator_1Data { public: double color_buffer[]; virtual void SetBuffer(int &buffer, int &plot); virtual void SetAsSeries(bool set); }; //+------------------------------------------------------------------+ void CIndicator_1Data1Color::SetBuffer(int &buffer, int &plot) { CIndicator_1Data::SetBuffer(buffer, plot); SetIndexBuffer(buffer, color_buffer, INDICATOR_COLOR_INDEX); buffer++; //Add color buffer } //+------------------------------------------------------------------+ void CIndicator_1Data1Color::SetAsSeries(bool set) { CIndicator_1Data::SetAsSeries(set); ArraySetAsSeries(color_buffer, set); } //...
每个类都包含(并设置)所需数量的缓冲区。 CIndicatorBufferBase 拥有的事件处理程序,可选择性地被任何类型的缓冲区类覆盖,CIndicatorPlotBase 包含所有作图板属性的设置器(和一个读值函数),每个基准数据类(可有或无颜色)包含缓冲区的数组声明和设置函数,且每个特定类都要重载函数 SetDrawType() ,并以 final 声明它,如此它就不能再次被重载(如果您需要未定义绘图类型的类,您应继承相应的基准数据类,并重载该函数)。
请注意,在此实现中,Update 拥有 OnCalculate 事件中所用的所有值,但如果不需要多态性,则可用较少的参数覆盖这些值。
ArraySetAsSeries 也包括在内,因为它是一个十分常见的函数,所有缓冲区几乎总是需要以相同的方式调用它进行设置。
现在我们已有了类,这样我们就可以创建一个指标了。 我们把这些琐碎之事汇总到一起作为示例:
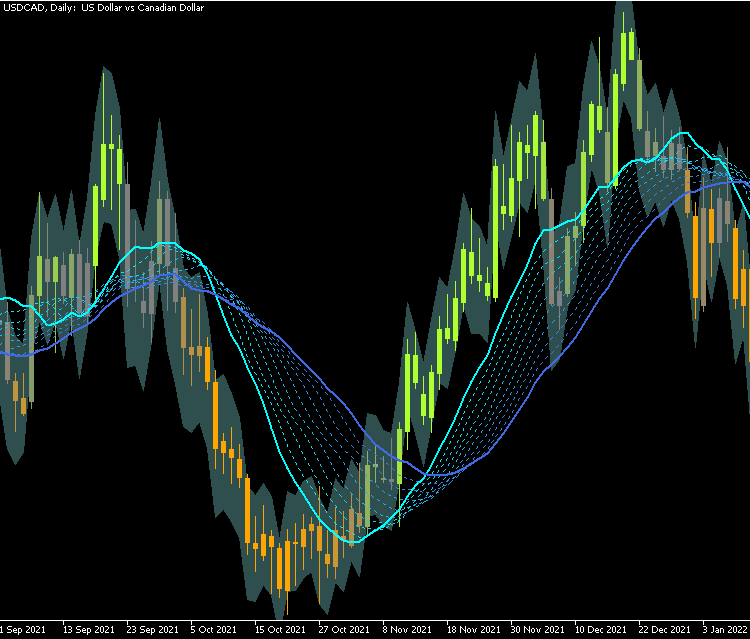
- 首先,我们将基于 ATR 指标创建波带,并将其显示为填充图。
- 然后,我们将创建 10 条具有不同周期的移动平均线,并在图表中将它们显示为折线图。
- 最后,我们将采用彩色蜡烛图,根据高于/低于波带的均线数量来改变蜡烛的颜色。
首先,我们将声明输入,并包含指标类的文件,以及我们在第 3 节中制作的颜色插值:
#property indicator_buffers 19 #property indicator_plots 13 #include <OOPIndicators/IndicatorClass.mqh> #include <OOPIndicators/ColorLerp.mqh> input int atr_period = 10; //ATR Period input double atr_band_multiplier = 0.8; //ATR Multiplier for bands input bool show_bands = true; //Show Bands input bool show_data = false; //Show Extra Data input int ma_faster_period = 14; //MA Faster Period input int ma_step = 2; //MA Step input ENUM_MA_METHOD ma_method = MODE_SMA; //MA Method
我们已经定义了所需数量的缓冲区和作图板。 您不必从一开始就要知道每个需要多少,但是正如您以后将在下面看到的那样,很容易就能找出该值(在 OnInit() 中)。
然后,我们将为指标的每个部分创建类。
从 ATR 波带开始:
//+------------------------------------------------------------------+ //| ATR Bands class (inherit from Filling Plot) | //+------------------------------------------------------------------+ class CATRBand : public CIndicatorPlotFilling { private: int handle; public: virtual void Init(); virtual void DeInit(); virtual void Update(const int limit, const int rates_total, const double &close[]); }; //+------------------------------------------------------------------+ void CATRBand::Init(void) { handle = iATR(NULL, PERIOD_CURRENT, atr_period); } //+------------------------------------------------------------------+ void CATRBand::Update(const int limit,const int rates_total,const double &close[]) { double atr[]; CopyBuffer(handle, 0, 0, rates_total-limit, atr); for (int i=limit; i<rates_total; i++) { first_array[i] = close[i]+atr[i-limit]*atr_band_multiplier; second_array[i] = close[i]-atr[i-limit]*atr_band_multiplier; } } //+------------------------------------------------------------------+ void CATRBand::DeInit(void) { IndicatorRelease(handle); }
MA 类,它在 Init() 中拥有周期和方法的参数:
//+------------------------------------------------------------------+ //| Moving Averages class (inherit from Line Plot) | //+------------------------------------------------------------------+ class CMA : public CIndicatorPlotLine { private: int handle; public: virtual void Init(int period, ENUM_MA_METHOD mode); virtual void DeInit(); virtual void Update(const int limit, const int rates_total); }; //+------------------------------------------------------------------+ void CMA::Init(int period, ENUM_MA_METHOD mode) { handle = iMA(NULL, PERIOD_CURRENT, period, 0, mode, PRICE_CLOSE); } //+------------------------------------------------------------------+ void CMA::Update(const int limit,const int rates_total) { if (limit==0) CopyBuffer(handle, 0, 0, rates_total, array); else { double newVals[]; CopyBuffer(handle, 0, 0, rates_total-limit, newVals); for (int i=limit; i<rates_total; i++) array[i] = newVals[i-limit]; } } //+------------------------------------------------------------------+ void CMA::DeInit(void) { IndicatorRelease(handle); }
还有蜡烛类。 在这种情况下,为了避免示例极端复杂,我们将从全局范围访问对象。 若您计划重用任何类,则不建议这样做。
它还包含我们将在下面声明的宏替换。注意:在代码里,函数位于宏替换的下方,但在此处显示的函数已重新排序。
//+------------------------------------------------------------------+ //| Color Candles class (inherit from Color Candles Plot) | //+------------------------------------------------------------------+ class CColorCandles : public CIndicatorPlotColorCandles { public: virtual void Update(const int limit, const int rates_total, const double &open[], const double &high[], const double &low[], const double &close[]); }; //+------------------------------------------------------------------+ void CColorCandles::Update(const int limit, const int rates_total, const double &open[], const double &high[], const double &low[], const double &close[]) { for (int i=limit; i<rates_total; i++) { open_array[i] = open[i]; high_array[i] = high[i]; low_array[i] = low[i]; close_array[i] = close[i]; int count_ma = TOTAL_MA; for (int m=0; m<TOTAL_MA; m++) { if (maIndicators[m].array[i] > bands.first_array[i]) count_ma++; if (maIndicators[m].array[i] < bands.second_array[i]) count_ma--; } color_buffer[i] = count_ma; //Update inside of this other object (to avoid making an extra inheritance, or an external loop) showIndex.array[i] = TOTAL_MA - count_ma; } }
现在我们必须声明对象,并配置缓冲区和作图板的视觉效果:
#define TOTAL_MA 10 CMA maIndicators[TOTAL_MA]; CATRBand bands; CColorCandles candles; CIndicatorPlotNone showIndex; //To show MAs above/below //+------------------------------------------------------------------+ //| Custom indicator initialization function | //+------------------------------------------------------------------+ int OnInit() { //--- indicator buffers mapping int buffer=0, plot=0; bands.SetBuffer(buffer, plot); candles.SetBuffer(buffer, plot); for (int i=0; i<TOTAL_MA; i++) maIndicators[i].SetBuffer(buffer, plot); showIndex.SetBuffer(buffer, plot); //Print("Buffers: ", buffer, " Plots: ", plot); //--- plot settings if (show_bands) bands.SetLineColor(clrDarkSlateGray); else bands.SetLineColor(clrNONE); bands.SetShowData(show_data); if (show_data) bands.SetLabel("Close + ATR;Close - ATR"); for (int i=0; i<TOTAL_MA; i++) { maIndicators[i].SetLineColor(InterpolateColors(clrAqua, clrRoyalBlue, i/(TOTAL_MA-1.0))); maIndicators[i].SetLabel("MA("+IntegerToString(ma_faster_period+i*ma_step)+")"); maIndicators[i].SetShowData(show_data); if (i>0 && i <TOTAL_MA-1) maIndicators[i].SetLineStyle(STYLE_DOT); else maIndicators[i].SetLineWidth(2); } color arrow_colors[TOTAL_MA*2+1]; for (int i=0; i<TOTAL_MA; i++) arrow_colors[i] = InterpolateColors(clrGreenYellow, clrGray, i/double(TOTAL_MA)); arrow_colors[TOTAL_MA] = clrGray; for (int i=TOTAL_MA+1; i<TOTAL_MA*2+1; i++) arrow_colors[i] = InterpolateColors(clrGray, clrOrange, (i-TOTAL_MA)/double(TOTAL_MA)); candles.SetColorIndexes(arrow_colors); candles.SetLabel("Open;High;Low;Close"); candles.SetShowData(false); showIndex.SetLabel("MAs above/below"); showIndex.SetShowData(true); //--- initialize classes bands.Init(); for (int i=0; i<TOTAL_MA; i++) maIndicators[i].Init(ma_faster_period+i*ma_step, ma_method); return(INIT_SUCCEEDED); }
按顺序,首先配置缓冲区,然后初始化作图板属性,然后初始化子指标(在其类中已指定)。
如前所说,您可以打印 buffer 和 plot 的变量值,来轻松知道所需的缓冲区和作图板数量。 然后,您就可以正确设置属性(在开始时,您还可以为它们设置比所需数量更高的数值来避免出错)。
另请注意,我们包含了 Plot None 类的一个实例。 该对象由蜡烛对象更新,因此它不需要特别的事件处理程序。 它显示数据窗口中高于或低于波带的均线数量。
最后,在其它的事件处理程序中没有太多功能,因为所有东西都在对象内部,只需要按照正确的顺序从对象调用这些函数:
//+------------------------------------------------------------------+ //| Custom indicator iteration function | //+------------------------------------------------------------------+ int OnCalculate(const int rates_total, const int prev_calculated, const datetime &time[], const double &open[], const double &high[], const double &low[], const double &close[], const long &tick_volume[], const long &volume[], const int &spread[]) { //--- int limit = MathMax(0, prev_calculated-1); bands.Update(limit, rates_total, close); for (int i=0; i<TOTAL_MA; i++) maIndicators[i].Update(limit, rates_total); candles.Update(limit, rates_total, open, high, low, close); //--- return value of prev_calculated for next call return(rates_total); } //+------------------------------------------------------------------+ //| Custom indicator deinitialization function | //+------------------------------------------------------------------+ void OnDeinit(const int reason) { bands.DeInit(); for (int i=0; i<TOTAL_MA; i++) maIndicators[i].DeInit(); }
指标的最终结果如下所示:
5. 该方法的限制
尽管它更便利,但用函数替代属性也有一些缺点:最明显的就是更改任何作图板的颜色/样式时受到的干扰,有时它们会有残留,有时它们会被初始化重写。
该问题可以用输入颜色(替代在“颜色”选项卡中更改它们)来避免,或检查是否存与默认的黑色 (0x000000) 不同。 这可适用于除黑色以外的所有颜色。
if (obj.GetInteger(PLOT_LINE_COLOR)==clrBlack) obj.SetLineColor(clrYellow);
另外,在本文中,我们尚未分析运用这些类对性能的影响。 理论上,直接用属性和少量函数应该更快速,但在大多数情况下意义不大。
最后,您可能已经注意到,这些类不包含图表事件,或 OnTimer。 原因在于图表事件最好直接在 OnChartEvent 中处理,完成后调用特定函数(而不是每次有事件时调用每个指标的处理程序,去多次处理每个事件)。 对于计时器,如果您的指标是多时间帧或多货币,则可依照不同的方式调用 Update 处理程序(您将无法直接访问 OnCalculate 的数组)。 有些人可能不认同这样的设计决策,即把用作缓冲区的数组声明为公开可见的:可以把数组设置为受保护可见,如此指标仍然可以工作,但您可能需要添加读值函数才能从外部访问数据。
6. 结束语
在本文中,我们思考并开发了一种方法,能够更轻松地创建复杂指标,并且代码行更少。 我们从针对特定案例的小规模技巧开始,然后实现一个允许重用和自定义功能的类结构,最后我们将所有内容组合到一个指标示例之中,该指标用到了本文所述的大多数功能。
本文由MetaQuotes Ltd译自英文
原文地址: https://www.mql5.com/en/articles/11233
MyFxtops迈投(www.myfxtops.com)-靠谱的外汇跟单社区,免费跟随高手做交易!
免责声明:本文系转载自网络,如有侵犯,请联系我们立即删除,另:本文仅代表作者个人观点,与迈投财经无关。其原创性以及文中陈述文字和内容未经本站证实,对本文以及其中全部或者部分内容、文字的真实性、完整性、及时性本站不作任何保证或承诺,请读者仅作参考,并请自行核实相关内容。
著作权归作者所有。
商业转载请联系作者获得授权,非商业转载请注明出处。