简介
指标喷发代表着时间序列研究领域的一种非常有前景的新方向。其特点在于:分析重点并不在于指标本身,而是其进入未来或过去的喷发。以此为基础,我们可以针对市场环境做出切实的预测:
- 未来的支撑位和阻力位;
- 趋势方向(价格变动);
- 过去积累的变动强度。
我的前一篇文章《用 MQL5 绘制指标的喷发》讲述的是喷发绘制算法并指定其关键功能。我提醒一下大家:
喷发是所考虑的指标特定线交叉点上的一组点。
反过来,喷发点也有一些特性:
- 同一类型的喷发点有集群倾向。
- 密集的集群可吸引价格,或反过来排斥价格。
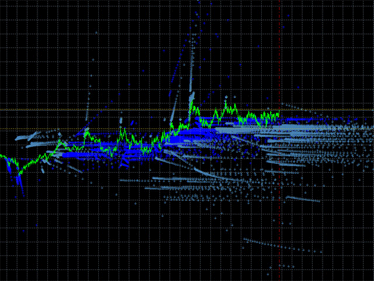
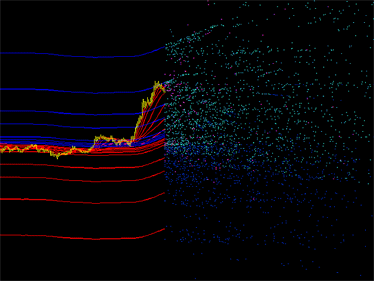
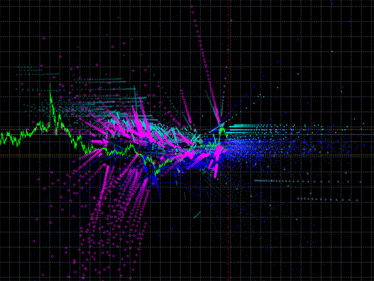
喷发图集:
 |
 |
|---|---|
 |
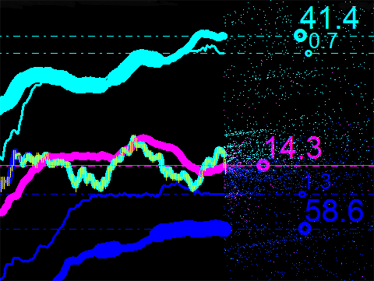 |
图 1. 指标喷发标绘示例左:DCMV 指标的喷发。右:iMA 与 iEnvelopes 指标的喷发。
在阐释喷发整体特性计算的过程中,我们会如下处理移动平均线轨道线和带有输入参数的移动平均线本身:
//--- external variable for storing averaging period of the iEnvelopes indicator
input int   ma_period=140; // averaging period of the iEnvelopes indicator
//--- array for storing deviations of the iEnvelopes indicator
double      ENV[]={0.01,0.0165,0.0273,0.0452,0.0747,01234,0.204,0.3373,0.5576,0.9217,1.5237};
//--- array for storing iMA indicator periods
int         MA[]={4,7,11,19,31,51,85};
这样一来,我们会查找选定指标特有线的交叉点。线数及其特征(平均周期与方差)为随机选择。实际上,喷发可利用这些指标的任何一组参数来标绘(只要它们在空间上有交叉)。
现在,指标已选取,我们继续创建一个 EA 交易,将来用其充当喷发分析的一个基础程序。我们需要从 iMA 和 iEnvelopes 技术指标中获取计算得出的数据。我提议使用《在 EA 交易中使用技术指标的指南》一文中讲到的一种方法。
要标绘需要找到交点的线,我们只需为每条线设置两个点。由此,只取得两个柱的指标值(比如当前和前一个柱)就足够了。前一柱上的价格是静态,而当前柱上的价格为动态,因此每一新的价格变动均会持续生成新点。代码如下:
//+------------------------------------------------------------------+
//|                                      emission_of_MA_envelope.mq5 |
//|                                           Copyright 2013, DC2008 |
//|                           https://www.mql5.com/ru/users/DC2008 |
//+------------------------------------------------------------------+
#property copyright "Copyright 2013, DC2008"
#property link      "https://www.mql5.com/ru/users/DC2008"
#property version   "1.00"
//---
#include <GetIndicatorBuffers.mqh>
#include <Emission.mqh>
//--- external variable for storing averaging period of the iEnvelopes indicator
input int   ma_period=140;      // averaging period of the iEnvelopes indicator
//--- array for storing deviations of the iEnvelopes indicator
double      ENV[]={0.01,0.0165,0.0273,0.0452,0.0747,01234,0.204,0.3373,0.5576,0.9217,1.5237};
//--- array for storing the iMA indicator periods
int         MA[]={4,7,11,19,31,51,85};
//--- array for storing pointers to the iMA and iEnvelopes indicators
int         handle_MA[];
int         handle_Envelopes[];
//--- market data
datetime    T[],prevTimeBar=0;
double      H[],L[];
#define     HL(a, b) (a+b)/2
//--- class instances
CEmission      EnvMa(0,300);
PointEmission  pEmission;
//--- drawing styles for points of emission
#define     COLOR_UPPER  C'51,255,255'
#define     COLOR_LOWER  C'0,51,255'
#define     COLOR_MA     C'255,51,255'
color       colorPoint[]={COLOR_UPPER,COLOR_LOWER,COLOR_MA};
CodeColor   styleUpper={158,COLOR_UPPER,SMALL};
CodeColor   styleLower={158,COLOR_LOWER,SMALL};
CodeColor   styleMA={158,COLOR_MA,SMALL};
//+------------------------------------------------------------------+
//| Expert initialization function                                   |
//+------------------------------------------------------------------+
int OnInit()
  {
   ArraySetAsSeries(T,true);
   ArraySetAsSeries(H,true);
   ArraySetAsSeries(L,true);
//---
   int size=ArraySize(MA);
   ArrayResize(handle_MA,size);
//--- create a pointer to the object - the iMA indicator
   for(int i=0; i<size; i++)
     {
      handle_MA[i]=iMA(NULL,0,MA[i],0,MODE_SMA,PRICE_MEDIAN);
      //--- if an error occurs when creating the object, print the message
      if(handle_MA[i]<0)
        {
         Print("The iMA object[",MA[i],"] has not been created: Error = ",GetLastError());
         //--- forced program termination
         return(-1);
        }
     }
//---
   size=ArraySize(ENV);
   ArrayResize(handle_Envelopes,size);
//--- create a pointer to the object - the iEnvelopes indicator
   for(int i=0; i<size; i++)
     {
      handle_Envelopes[i]=iEnvelopes(NULL,0,ma_period,0,MODE_SMA,PRICE_MEDIAN,ENV[i]);
      //--- if an error occurs when creating the object, print the message
      if(handle_Envelopes[i]<0)
        {
         Print("The iEnvelopes object[",ENV[i],"] has not been created: Error = ",GetLastError());
         //--- forced program termination
         return(-1);
        }
     }
//---
   return(0);
  }
//+------------------------------------------------------------------+
//| Expert deinitialization function                                 |
//+------------------------------------------------------------------+
void OnDeinit(const int reason)
  {
//---

  }
//+------------------------------------------------------------------+
//| Expert tick function                                             |
//+------------------------------------------------------------------+
void OnTick()
  {
//--- market data
   CopyTime(NULL,0,0,2,T);
   CopyHigh(NULL,0,0,2,H);
   CopyLow(NULL,0,0,2,L);
//--- fill the declared arrays with current values from all indicator buffers
   string name;
   uint GTC=GetTickCount();
//---- indicator buffers
   double   ibMA[],ibMA1[];      // arrays for the iMA indicator
   double   ibEnvelopesUpper[];  // array for the iEnvelopes indicator (UPPER_LINE)
   double   ibEnvelopesLower[];  // array for the iEnvelopes indicator (LOWER_LINE)
   for(int i=ArraySize(handle_MA)-1; i>=0; i--)
     {
      if(!CopyBufferAsSeries(handle_MA[i],0,0,2,true,ibMA))
         return;
      //---
      for(int j=ArraySize(handle_Envelopes)-1; j>=0; j--)
        {
         if(!GetEnvelopesBuffers(handle_Envelopes[j],0,2,ibEnvelopesUpper,ibEnvelopesLower,true))
            return;
         //--- find the intersection point of the iEnvelopes(UPPER_LINE) and iMA indicators
         pEmission=EnvMa.CalcPoint(ibEnvelopesUpper[1],ibEnvelopesUpper[0],ibMA[1],ibMA[0],T[0]);
         if(pEmission.real) // if the intersection point is found, draw it in the chart
           {
            name="iEnvelopes(UPPER_LINE)"+(string)j+"=iMA"+(string)i+(string)GTC;
            EnvMa.CreatePoint(name,pEmission,styleUpper);
           }
         //--- find the intersection point of the iEnvelopes(LOWER_LINE) and iMA indicators
         pEmission=EnvMa.CalcPoint(ibEnvelopesLower[1],ibEnvelopesLower[0],ibMA[1],ibMA[0],T[0]);
         if(pEmission.real) // if the intersection point is found, draw it in the chart
           {
            name="iEnvelopes(LOWER_LINE)"+(string)j+"=iMA"+(string)i+(string)GTC;
            EnvMa.CreatePoint(name,pEmission,styleLower);
           }
        }
      //---
      for(int j=ArraySize(handle_MA)-1; j>=0; j--)
        {
         if(i!=j)
           {
            if(!CopyBufferAsSeries(handle_MA[j],0,0,2,true,ibMA1))
               return;
            //--- find the intersection point of the iMA and iMA indicators
            pEmission=EnvMa.CalcPoint(ibMA1[1],ibMA1[0],ibMA[1],ibMA[0],T[0]);
            if(pEmission.real) // if the intersection point is found, draw it in the chart
              {
               name="iMA"+(string)j+"=iMA"+(string)i+(string)GTC;
               EnvMa.CreatePoint(name,pEmission,styleMA);
              }
           }
        }
     }
//--- deletion of the graphical objects of emission not to stuff the chart
   if(T[0]>prevTimeBar) // delete once per bar
     {
      int  total=ObjectsTotal(0,0,-1);
      prevTimeBar=T[0];
      for(int obj=total-1;obj>=0;obj--)
        {
         string obj_name=ObjectName(0,obj,0,OBJ_TEXT);
         datetime obj_time=(datetime)ObjectGetInteger(0,obj_name,OBJPROP_TIME);
         if(obj_time<T[0])
            ObjectDelete(0,obj_name);
        }
      Comment("Emission © DC2008       Objects = ",total);
     }
//---
  }
我不会详细讲解此 EA 交易的每一个细节。这里要注意的主要就是标绘喷发,我们采用负责任何两条线交叉点的计算和显示的 CEmission 类实例。
//+------------------------------------------------------------------+
//|                                                     Emission.mqh |
//|                                           Copyright 2013, DC2008 |
//|                           https://www.mql5.com/ru/users/DC2008 |
//+------------------------------------------------------------------+
#property copyright "Copyright 2013, DC2008"
#property link      "https://www.mql5.com/ru/users/DC2008"
#property version   "1.00"
#define  BIG   7    // point size
#define  SMALL 3    // point size
//+------------------------------------------------------------------+
//| pMABB structure                                                  |
//+------------------------------------------------------------------+
struct PointEmission
  {
   double            x;       // X-coordinate of the time point
   double            y;       // Y-coordinate of the price point
   datetime          t;       // t-coordinate of the point's time
   bool              real;    // whether the point exists
  };
//+------------------------------------------------------------------+
//| CodeColor structure                                              |
//+------------------------------------------------------------------+
struct CodeColor
  {
   long              Code;    // point symbol code
   color             Color;   // point color
   int               Width;   // point size
  };
//+------------------------------------------------------------------+
//| Base class for emissions                                         |
//+------------------------------------------------------------------+
class CEmission
  {
private:
   int               sec;
   int               lim_Left;   // limiting range of visibility in bars
   int               lim_Right;  // limiting range of visibility in bars

public:
   PointEmission     CalcPoint(double   y1,  // Y-coordinate of straight line 1 on bar [1]
                               double   y0,  // Y-coordinate of straight line 1 on bar [0]
                               double   yy1, // Y-coordinate of straight line 2 on bar [1]
                               double   yy0, // Y-coordinate of straight line 2 on bar [0]
                               datetime t0   // t-coordinate of the current bar Time[0]
                               );
   bool              CreatePoint(string name,            // point name
                                 PointEmission &point,   // coordinates of the point
                                 CodeColor &style);      // point drawing style
                                 CEmission(int limitLeft,int limitRight);
                    ~CEmission();
  };
//+------------------------------------------------------------------+
//|                                                                  |
//+------------------------------------------------------------------+
CEmission::CEmission(int limitLeft,int limitRight)
  {
   sec=PeriodSeconds();
   lim_Left=limitLeft;
   lim_Right=limitRight;
  }
//+------------------------------------------------------------------+
//|                                                                  |
//+------------------------------------------------------------------+
CEmission::~CEmission()
  {
  }
//+------------------------------------------------------------------+
//| The CalcPoint method of the CEmission class                      |
//+------------------------------------------------------------------+
PointEmission CEmission::CalcPoint(double   y1, // Y-coordinate of straight line 1 on bar [1]
                                   double   y0, // Y-coordinate of straight line 1 on bar [0]
                                   double   yy1,// Y-coordinate of straight line 2 on bar [1]
                                   double   yy0,// Y-coordinate of straight line 2 on bar [0]
                                   datetime t0  // t-coordinate of the current bar Time[0]
                                   )
  {
   PointEmission point={NULL,NULL,NULL,false};
   double y0y1=y0-y1;
   double y1yy1=y1-yy1;
   double yy0yy1=yy0-yy1;
   double del0=yy0yy1-y0y1;
   if(MathAbs(del0)>0)
     {
      point.x=y1yy1/del0;
      if(point.x<lim_Left || point.x>lim_Right) return(point);
      point.y=y1+y0y1*y1yy1/del0;
      if(point.y<0) return(point);
      point.t=t0+(int)(point.x*sec);
      point.real=true;
      return(point);
     }
   return(point);
  }
//+------------------------------------------------------------------+
//| The CreatePoint method of the CEmission class                    |
//+------------------------------------------------------------------+
bool CEmission::CreatePoint(string name,            // point name
                            PointEmission &point,  // coordinates of the point
                            CodeColor &style)      // point drawing style
  {
   if(ObjectCreate(0,name,OBJ_TEXT,0,0,0))
     {
      ObjectSetString(0,name,OBJPROP_FONT,"Wingdings");
      ObjectSetInteger(0,name,OBJPROP_ANCHOR,ANCHOR_CENTER);
      ObjectSetInteger(0,name,OBJPROP_FONTSIZE,style.Width);
      ObjectSetString(0,name,OBJPROP_TEXT,CharToString((uchar)style.Code));
      ObjectSetDouble(0,name,OBJPROP_PRICE,point.y);
      ObjectSetInteger(0,name,OBJPROP_TIME,point.t);
      ObjectSetInteger(0,name,OBJPROP_COLOR,style.Color);
      return(true);
     }
   return(false);
  }
要注意的是,喷发点是通过图形对象(比如 Text)的方式来描述的。首先,这源于对象锚点应对准符号中心的事实。其次,您可以大范围调整对象尺寸。上述点属性为获取复杂喷发提供了巨大潜力。
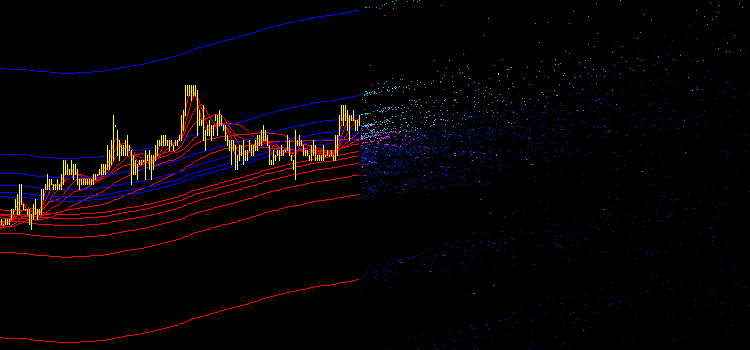
图 2. iMA 与 iEnvelopes 指标的初始喷发
喷发的整体特征
将提议的 EA 交易放到图表上后,我们得到了大量不同颜色的点(参见图 2):
- 浅绿色 – iMA 与 iEnvelopes 的交叉点,UPPER_LINE 缓冲区。
- 蓝色 – iMA 与 iEnvelopes 交叉点,LOWER_LINE 缓冲区。
- 洋红色 – iMA 与 iMA 交叉点。
这种混乱无法用于自动化交易。我们需要信号、价位和其它量化市场特征,而我们这里只得到了一厢情愿的可视图像,却没有任何数字。
喷发的整体特征用于归纳作为指标喷发结果获得的数据。
而对于喷发整体特征的需求,亦因它们为采用新型指标的市场调查提供了机会而得到推进:整体的通道、线、水平、信号等等。要确定最典型的喷发值,我们将从小处开始,计算每个点类型的平均价格,从而通过它们,如下进一步绘制水平线:
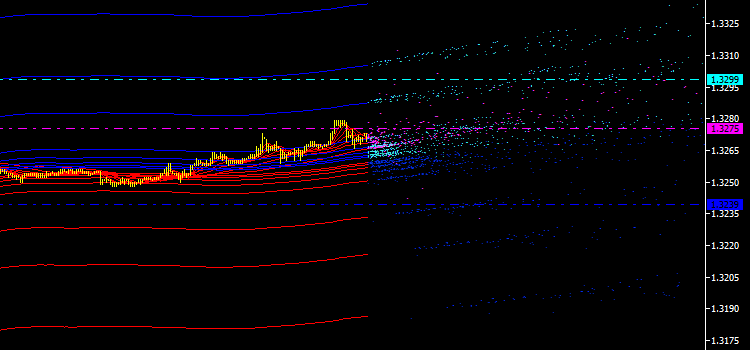
图 3. 每个点类型平均价格的水平线
为此,我们将向现有代码中添加一些附加的代码块。到数据部分:
//--- arrays for calculation and display of integral characteristics of emissions
#define     NUMBER_TYPES_POINT   3
double      sum[NUMBER_TYPES_POINT],sumprev[NUMBER_TYPES_POINT];
datetime    sum_time[NUMBER_TYPES_POINT];
int         n[NUMBER_TYPES_POINT],W[NUMBER_TYPES_POINT];
color       colorLine[]={clrAqua,clrBlue,clrMagenta};
到 OnTick() 模块:
//--- calculation of integral characteristics of emissions
   ArrayInitialize(n,0);
   ArrayInitialize(sum,0.0);
   ArrayInitialize(sum_time,0.0);
   for(int obj=total-1;obj>=0;obj--)
     {
      string   obj_name=ObjectName(0,obj,0,OBJ_TEXT);
      datetime obj_time=(datetime)ObjectGetInteger(0,obj_name,OBJPROP_TIME);
      if(obj_time>T[0])
        {
         color    obj_color=(color)ObjectGetInteger(0,obj_name,OBJPROP_COLOR);
         double   obj_price=ObjectGetDouble(0,obj_name,OBJPROP_PRICE);
         for(int i=ArraySize(n)-1; i>=0; i--)
            if(obj_color==colorPoint[i])
              {
               n[i]++;
               sum[i]+=obj_price;
               sum_time[i]+=obj_time;
              }
        }
     }
//--- displaying integral characteristics of emissions
   for(int i=ArraySize(n)-1; i>=0; i--)
     {
      if(n[i]>0)
        {
         name="H.line."+(string)i;
         ObjectCreate(0,name,OBJ_HLINE,0,0,0,0);
         ObjectSetInteger(0,name,OBJPROP_COLOR,colorLine[i]);
         ObjectSetInteger(0,name,OBJPROP_STYLE,STYLE_DASHDOT);
         ObjectSetInteger(0,name,OBJPROP_WIDTH,1);
         ObjectSetDouble(0,name,OBJPROP_PRICE,sum[i]/n[i]);
        }
     }
让我们继续。现在,我们来计算每个点集的平均时间值,并在平均价格的对应线上标出(参见图 4)。由此,我们已经得到了喷发的第一批量化特征:从不静止,始终在空间内移动。
此图表仅能显示其瞬间的位置。我们需要通过某种方式,将其固定于历史当中,从而能够过后研究。到目前为止,怎样才能实现这个目标仍不清楚,我们需要再好好想想……与此同时,我们会进行进一步的改进,并在图表的标记旁边显示计算当中涉及到的点数。这些都是所获特征的某种权重,在进一步分析中也有用处。
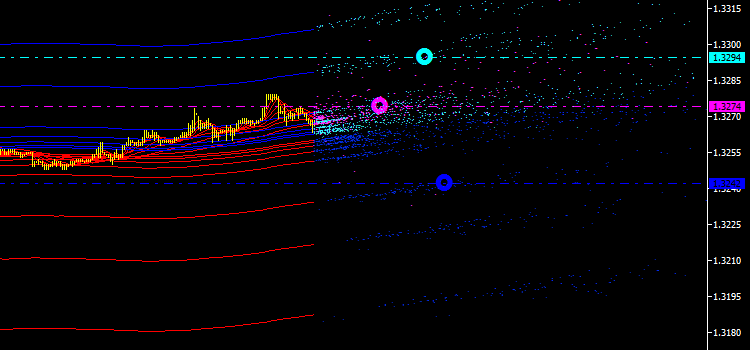
图 4. 平均价格与平均时间交叉点的标记
但是,为方便分析,我们将采用它们的百分比。因为主要的喷发点都是由 iMA 和 iEnvelopes 指标的交叉产生,所以我们将其和视为 100%。来看看我们现在有了什么:
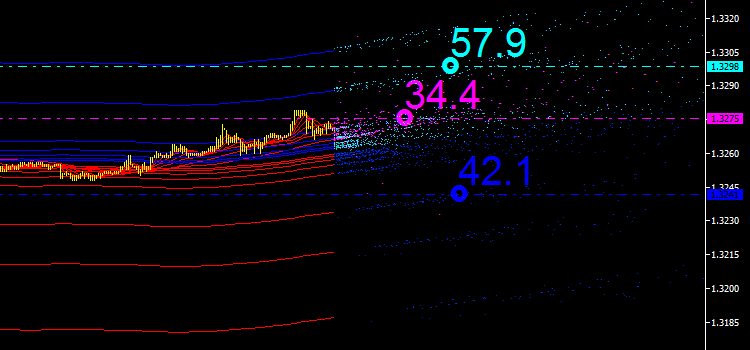
图 5. 每种喷发点类型的百分比
如果我们将三个值加起来,总数就会超过 100%。呈洋红色显示的值 34.4 为某特定时间点 iMA 和 iMA 交叉点的属性,即该指标自行交叉,却有不同的输入数据。这种情况下,这就是一个参考值,至于如何用它进行市场分析,我们稍后再研究。
但是,当我们得到点数的百分比后,又出现了一个问题:我们怎样才能固定历史中的喷发特征百分比值,尤其是它们确实在变化的时候?!
图形分析
尽管我们现在掌握了喷发的整体特征,但根据所获数据,还是与交易策略的分析和开发不够接近。但是,细心的读者肯定已经发现了这一问题的解决办法(参见图 1)。办法如下:我提议利用与主喷发点的百分比成比例的不同厚度,来绘制整体曲线。
该曲线的当前部分,将沿着当前与前一柱之间的平均价格线绘制,谨记这些坐标实际上取自将来。它是指标喷发的某种主导整体通道。我知道,这听起来确实让人迷惑……而且,您肯定在想是否要继续读下去。但我确实希望,继续下去会变得越来越有趣。
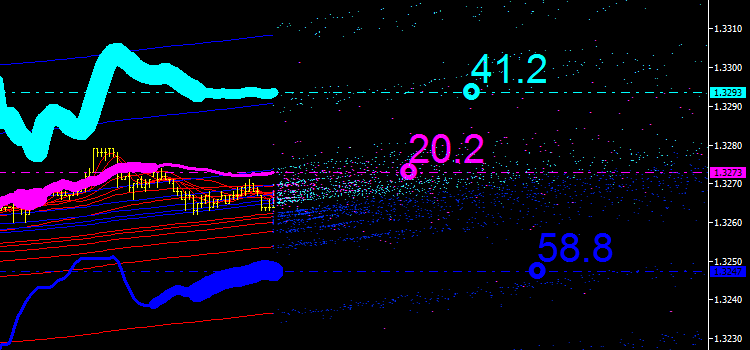
图 6. 指标喷发的整体通道
如此一来,我们似乎为 “iMA & iMA” 喷发找到了一些用处(在图表中呈洋红色显示)。而且,我们得到了一个新指标 – 整合移动平均线。
我们现在返回到 EA 交易的代码,看看 OnTick() 模块中发生了哪些变化:
//--- displaying integral characteristics of emissions
   ArrayInitialize(W,10);
   W[ArrayMaximum(n)]=20;
   W[ArrayMinimum(n)]=3;
   for(int i=ArraySize(n)-1; i>=0; i--)
     {
      if(n[i]>0)
        {
         //--- horizontal lines of mean prices
         name="H.line."+(string)i;
         ObjectCreate(0,name,OBJ_HLINE,0,0,0,0);
         ObjectSetInteger(0,name,OBJPROP_COLOR,colorLine[i]);
         ObjectSetInteger(0,name,OBJPROP_STYLE,STYLE_DASHDOT);
         ObjectSetInteger(0,name,OBJPROP_WIDTH,1);
         ObjectSetDouble(0,name,OBJPROP_PRICE,sum[i]/n[i]);
         //--- markers
         name="P."+(string)i;
         ObjectCreate(0,name,OBJ_TEXT,0,0,0);
         ObjectSetString(0,name,OBJPROP_FONT,"Wingdings");
         ObjectSetInteger(0,name,OBJPROP_ANCHOR,ANCHOR_CENTER);
         ObjectSetInteger(0,name,OBJPROP_FONTSIZE,17);
         ObjectSetString(0,name,OBJPROP_TEXT,CharToString(163));
         ObjectSetInteger(0,name,OBJPROP_COLOR,colorLine[i]);
         ObjectSetDouble(0,name,OBJPROP_PRICE,sum[i]/n[i]);
         ObjectSetInteger(0,name,OBJPROP_TIME,sum_time[i]/n[i]);
         //--- integral curves
         name="T"+(string)i+".line"+(string)T[1];
         ObjectCreate(0,name,OBJ_TREND,0,0,0);
         ObjectSetInteger(0,name,OBJPROP_COLOR,colorLine[i]);
         ObjectSetInteger(0,name,OBJPROP_WIDTH,W[i]);
         if(sumprev[i]>0)
           {
            ObjectSetDouble(0,name,OBJPROP_PRICE,0,sumprev[i]);
            ObjectSetInteger(0,name,OBJPROP_TIME,0,T[1]);
            ObjectSetDouble(0,name,OBJPROP_PRICE,1,(sum[i]/n[i]));
            ObjectSetInteger(0,name,OBJPROP_TIME,1,T[0]);
           }
         //--- numerical values of integral characteristics
         name="Text"+(string)i+".control";
         ObjectCreate(0,name,OBJ_TEXT,0,0,0);
         ObjectSetInteger(0,name,OBJPROP_ANCHOR,ANCHOR_LEFT_LOWER);
         ObjectSetInteger(0,name,OBJPROP_FONTSIZE,30);
         ObjectSetInteger(0,name,OBJPROP_COLOR,colorLine[i]);
         string str=DoubleToString((double)n[i]/(double)(n[0]+n[1])*100,1);
         ObjectSetString(0,name,OBJPROP_TEXT,str);
         ObjectSetDouble(0,name,OBJPROP_PRICE,0,(sum[i]/n[i]));
         ObjectSetInteger(0,name,OBJPROP_TIME,0,sum_time[i]/n[i]);
        }
     }
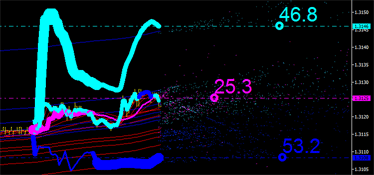
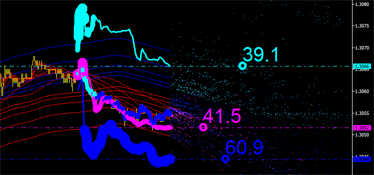
继续我们的图形分析。但是,缺了点什么……似乎我们漏掉了另一个重要的喷发特征。整体曲线仅仅是根据平均价格绘制。然而,我们需要考虑到平均时间坐标。看看下图,尤其要注意通道限制:
- 浅绿色线为通道上限。
- 蓝色线为通道下限。
我们需要找到时间上与零柱更接近的标记。
 |
 |
|---|
图 7. 时间方面的整体特征主导。左:通道的主导上限。右:通道的主导下限。
此问题可如下解决:我们将价格线 (PRICE_MEDIAN) 添加到价格图表,且令此线根据更接近最后一个柱的标记颜色(浅绿或蓝色)改变其颜色(参见图 7)。此外,我们还向现有代码中插入下述代码块:
//---
   if(n[ArrayMinimum(n)]>0)
     {
      datetime d[2];
      for(int j=0;j<2;j++)
        {
         d[j]=sum_time[j]/n[j];
        }
      int i=ArrayMinimum(d);

      name="Price.line"+(string)T[1];
      ObjectCreate(0,name,OBJ_TREND,0,0,0);
      ObjectSetInteger(0,name,OBJPROP_WIDTH,8);
      ObjectSetDouble(0,name,OBJPROP_PRICE,0,HL(H[1],L[1]));
      ObjectSetInteger(0,name,OBJPROP_TIME,0,T[1]);
      ObjectSetDouble(0,name,OBJPROP_PRICE,1,HL(H[0],L[0]));
      ObjectSetInteger(0,name,OBJPROP_TIME,1,T[0]);
      ObjectSetInteger(0,name,OBJPROP_COLOR,colorLine1[i]);
     }
//---
现在,做好继续下一步的准备。如果我们尝试根据初始喷发的整体特征绘制喷发(有点类似于二阶喷发),那会怎样?这些线毕竟也会彼此交叉,而且也会随之产生喷发点。我们来看看,它会带来些什么。添加下述代码行,强化之前的代码块:
      //--- emissions of integral characteristics of the original emissions
      pEmission=EnvMa.CalcPoint(sumprev[0],sum[0]/n[0],sumprev[2],sum[2]/n[2],T[0]);
      if(pEmission.real) // if the intersection point is found, draw it in the chart
        {
         name="test/up"+(string)GTC;
         EnvMa.CreatePoint(name,pEmission,styleUpper2);
        }
      pEmission=EnvMa.CalcPoint(sumprev[1],sum[1]/n[1],sumprev[2],sum[2]/n[2],T[0]);
      if(pEmission.real) // if the intersection point is found, draw it in the chart
        {
         name="test/dn"+(string)GTC;
         EnvMa.CreatePoint(name,pEmission,styleLower2);
        }
再将下述行插入到数据部分中:
#define     COLOR_2_UPPER  C'102,255,255'
#define     COLOR_2_LOWER  C'51,102,255'
CodeColor   styleUpper2={178,COLOR_2_UPPER,BIG};
CodeColor   styleLower2={178,COLOR_2_LOWER,BIG};
您可以在下图中检查结果。我们可以看到新点,但目前为止没有任何意义。
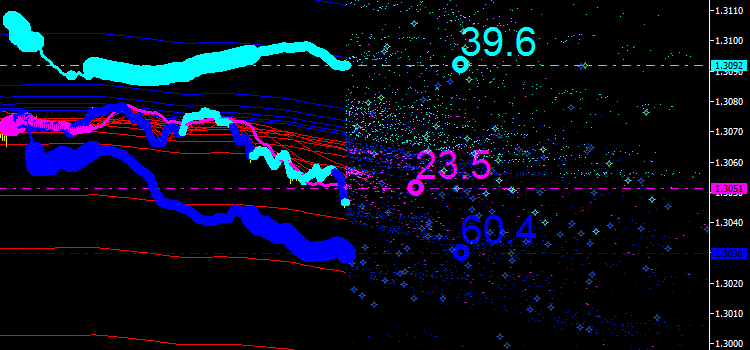
图 8. 整体线的喷发
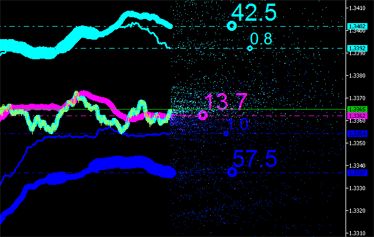
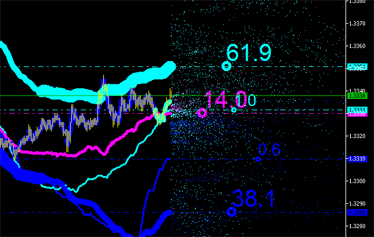
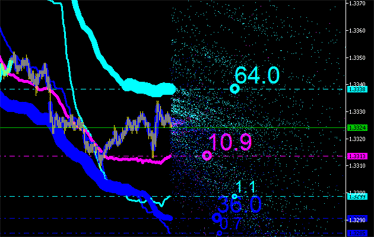
很明显,还要针对新点(参见图 9)计算整体特征,且将其喷发绘于图表当中,如此重复,直到不可行为止!
 |
 |
 |
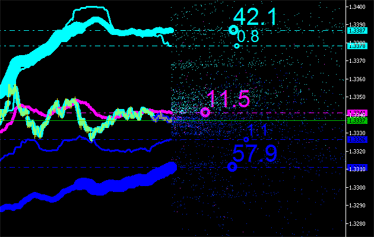 |
图 9. 喷发的整体特征
如此一来,我们即绘制了需要的一切,并获得了喷发的整体特征。我们现在可以继续交易策略的分析和开发了。但看起来还是不可能!现在,又是什么在阻碍我们呢?
喷发的时间序列
图形分析让我们能够研究喷发的整体特征,但它太过于资源密集。如果我们试着在策略测试程序的可视模式下运行提议的代码,测试速度转眼间就会掉落到零!这是由于图表中有大量的图形对象。
所以,自然就会有人想摆脱掉这大量的点,只留下整合曲线。要解决这一问题,我们会使用专用数组(缓冲区)。
喷发的时间序列是专用的数组,而喷发相关信息就积累于此。
它们与标准的时间序列不同,其所包含的数据并非按时间排序,尽管时间也是关键字段。

图 10. 喷发特征的时间序列
这些数组的排列方式为:新元素被存储于空单元格中,或是装有原值的单元格中。为此,我们将使用 CTimeEmission 类。下面是代码中的实现方式:
//+------------------------------------------------------------------+
//|                                                 TimeEmission.mqh |
//|                                           Copyright 2013, DC2008 |
//|                           https://www.mql5.com/ru/users/DC2008 |
//+------------------------------------------------------------------+
#property copyright "Copyright 2013, DC2008"
#property link      "https://www.mql5.com/ru/users/DC2008"
#property version   "1.00"
//---
#include <Emission.mqh>
#define ARRMAX       64
#define ARRDELTA     8
//+------------------------------------------------------------------+
//| pIntegral structure                                              |
//+------------------------------------------------------------------+
struct pIntegral
  {
   double            y;       // Y-coordinate of the price point (mean price of the points with the same time)
   datetime          t;       // t-coordinate of the point's time
   int               n;       // n-number of points with the same time
  };
//+------------------------------------------------------------------+
//| Base class for time series of emissions                          |
//+------------------------------------------------------------------+
class CTimeEmission
  {
private:
   pIntegral         time_series_Emission[]; // time series of emission
   int               size_ts; // number of elements in time series
   datetime           t[1];
public:
   //--- method of writing new elements to time series of emission
   void              Write(PointEmission &point);
   //--- method of reading integral characteristics of emissions
   pIntegral         Read();
                     CTimeEmission();
                    ~CTimeEmission();
  };

//+------------------------------------------------------------------+
//|                                                                  |
//+------------------------------------------------------------------+
CTimeEmission::CTimeEmission()
  {
   ArrayResize(time_series_Emission,ARRMAX,ARRMAX);
   size_ts=ArraySize(time_series_Emission);
   for(int i=size_ts-1; i>=0; i--)
      time_series_Emission[i].t=0;
  }
//+------------------------------------------------------------------+
//|                                                                  |
//+------------------------------------------------------------------+
CTimeEmission::~CTimeEmission()
  {
  }
//+------------------------------------------------------------------+
//| The Write method of the CTimeEmission class                      |
//+------------------------------------------------------------------+
void CTimeEmission::Write(PointEmission &point)
  {
   CopyTime(NULL,0,0,1,t);
   size_ts=ArraySize(time_series_Emission);
   for(int k=0;k<size_ts;k++)
     {
      if(time_series_Emission[k].t<t[0]) // find the first empty cell
        {
         if(k>size_ts-ARRDELTA)
           {   // increase the array size, if necessary
            int narr=ArrayResize(time_series_Emission,size_ts+ARRMAX,ARRMAX);
            for(int l=size_ts-1;l<narr;l++)
               time_series_Emission[l].t=0;
           }
         time_series_Emission[k].y=point.y;
         time_series_Emission[k].t=point.t;
         time_series_Emission[k].n=1;
         return;
        }
      if(time_series_Emission[k].t==point.t) // find the first similar cell
        {
         time_series_Emission[k].y=(time_series_Emission[k].y*time_series_Emission[k].n+point.y)/(time_series_Emission[k].n+1);
         time_series_Emission[k].n++;
         return;
        }
     }
  }
//+------------------------------------------------------------------+
//| The Read method of the CTimeEmission class                       |
//+------------------------------------------------------------------+
pIntegral CTimeEmission::Read()
  {
   CopyTime(NULL,0,0,1,t);
   pIntegral property_Emission={0.0,0,0};
   size_ts=ArraySize(time_series_Emission);
   for(int k=0;k<size_ts;k++)
     {
      if(time_series_Emission[k].t>=t[0])
        {
         property_Emission.y+=time_series_Emission[k].y*time_series_Emission[k].n;
         property_Emission.t+=(time_series_Emission[k].t-t[0])*time_series_Emission[k].n;
         property_Emission.n+=time_series_Emission[k].n;
        }
     }
   if(property_Emission.n>0)
     {
      property_Emission.y=property_Emission.y/property_Emission.n;
      property_Emission.t=property_Emission.t/property_Emission.n+t[0];
     }
   return(property_Emission);
  }
我们在这里可以看到两种类方法的实施:将喷发点写入时间序列,并读取喷发整体特征值。
整体特征的俭省计算
现在,我们拥有了喷发的时间序列,可以为整体特征的计算创建一种俭省算法、进而开发一种交易策略了。我们来更新最初的 EA 交易:
//+------------------------------------------------------------------+
//|                                   emission_of_MA_envelope_ts.mq5 |
//|                                           Copyright 2013, DC2008 |
//|                           https://www.mql5.com/ru/users/DC2008 |
//+------------------------------------------------------------------+
#property copyright "Copyright 2013, DC2008"
#property link      "https://www.mql5.com/ru/users/DC2008"
#property version   "1.00"
//---
#include <GetIndicatorBuffers.mqh>
#include <Emission.mqh>
#include <TimeEmission.mqh>
//--- number of point types
#define     NUMBER_TYPES_POINT   3
//--- array for storing the iMA indicator periods
int      MA[]={4,7,11,19,31,51,85};
//--- external variable for storing averaging period of the iEnvelopes indicator
input int ma_period=140; // averaging period of the iEnvelopes indicator
//--- array for storing deviations of the iEnvelopes indicator
double   ENV[]={0.01,0.0165,0.0273,0.0452,0.0747,01234,0.204,0.3373,0.5576,0.9217,1.5237};
//--- array for storing pointers to the iMA indicator
int      handle_MA[];
//--- array for storing pointers to the iEnvelopes indicator
int      handle_Envelopes[];
//--- market data
datetime    T[],prevTimeBar=0;
double      H[],L[];
#define     HL(a, b) (a+b)/2
//--- class instances
CEmission      EnvMa(0,200);
PointEmission  pEmission;
CTimeEmission  tsMA[NUMBER_TYPES_POINT];
pIntegral      integral[NUMBER_TYPES_POINT];
//--- drawing styles for points of emission
#define     DEL            500
//--- arrays for calculation and display of integral characteristics of emissions
double      sumprev[NUMBER_TYPES_POINT];
int         n[NUMBER_TYPES_POINT],W[NUMBER_TYPES_POINT];
color       colorLine[]={clrAqua,clrBlue,clrMagenta};
int         fontPoint[]={30,30,30};
int         fontMarker[]={16,16,16};
//+------------------------------------------------------------------+
//| Expert initialization function                                   |
//+------------------------------------------------------------------+
int OnInit()
  {
   ArraySetAsSeries(T,true);
   ArraySetAsSeries(H,true);
   ArraySetAsSeries(L,true);
   ArrayInitialize(sumprev,0.0);
//---
   int size=ArraySize(MA);
   ArrayResize(handle_MA,size);
//--- create a pointer to the object - the iMA indicator
   for(int i=0; i<size; i++)
     {
      handle_MA[i]=iMA(NULL,0,MA[i],0,MODE_SMA,PRICE_MEDIAN);
      //--- if an error occurs when creating the object, print the message
      if(handle_MA[i]<0)
        {
         Print("The iMA object[",MA[i],"] has not been created: Error = ",GetLastError());
         //--- forced program termination
         return(-1);
        }
     }
//+------------------------------------------------------------------+
   size=ArraySize(ENV);
   ArrayResize(handle_Envelopes,size);
//--- create a pointer to the object - the iEnvelopes indicator
   for(int i=0; i<size; i++)
     {
      handle_Envelopes[i]=iEnvelopes(NULL,0,ma_period,0,MODE_SMA,PRICE_MEDIAN,ENV[i]);
      //--- if an error occurs when creating the object, print the message
      if(handle_Envelopes[i]<0)
        {
         Print("The iEnvelopes object[",ENV[i],"] has not been created: Error = ",GetLastError());
         //--- forced program termination
         return(-1);
        }
     }
//---
   return(0);
  }
//+------------------------------------------------------------------+
//| Expert deinitialization function                                 |
//+------------------------------------------------------------------+
void OnDeinit(const int reason)
  {
//---

  }
//+------------------------------------------------------------------+
//| Expert tick function                                             |
//+------------------------------------------------------------------+
void OnTick()
  {
//--- market data
   CopyTime(NULL,0,0,2,T);
   CopyHigh(NULL,0,0,2,H);
   CopyLow(NULL,0,0,2,L);
//--- fill the declared arrays with current values from all indicator buffers
   string name;
   uint GTC=GetTickCount();
//---- indicator buffers
   double   ibMA[],ibMA1[];      // arrays for the iMA indicator
   double   ibEnvelopesUpper[];  // array for the iEnvelopes indicator (UPPER_LINE)
   double   ibEnvelopesLower[];  // array for the iEnvelopes indicator (LOWER_LINE)
   for(int i=ArraySize(handle_MA)-1; i>=0; i--)
     {
      if(!CopyBufferAsSeries(handle_MA[i],0,0,2,true,ibMA))
         return;
      //---
      for(int j=ArraySize(handle_Envelopes)-1; j>=0; j--)
        {
         if(!GetEnvelopesBuffers(handle_Envelopes[j],0,2,ibEnvelopesUpper,ibEnvelopesLower,true))
            return;
         //--- find the intersection point of the iEnvelopes(UPPER_LINE) and iMA indicators
         pEmission=EnvMa.CalcPoint(ibEnvelopesUpper[1],ibEnvelopesUpper[0],ibMA[1],ibMA[0],T[0]);
         if(pEmission.real) // if the intersection point is found, add it to the time series of emission
            tsMA[0].Write(pEmission);
         //--- find the intersection point of the iEnvelopes(LOWER_LINE) and iMA indicators
         pEmission=EnvMa.CalcPoint(ibEnvelopesLower[1],ibEnvelopesLower[0],ibMA[1],ibMA[0],T[0]);
         if(pEmission.real) // if the intersection point is found, add it to the time series of emission
            tsMA[1].Write(pEmission);
        }
      //---
      for(int j=ArraySize(handle_MA)-1; j>=0; j--)
        {
         if(i!=j)
           {
            if(!CopyBufferAsSeries(handle_MA[j],0,0,2,true,ibMA1))
               return;
            //--- find the intersection point of the iMA and iMA indicators
            pEmission=EnvMa.CalcPoint(ibMA1[1],ibMA1[0],ibMA[1],ibMA[0],T[0]);
            if(pEmission.real) // if the intersection point is found, add it to the time series of emission
               tsMA[2].Write(pEmission);
           }
        }
     }
//--- deletion of the graphical objects of emission not to stuff the chart
   if(T[0]>prevTimeBar)
     {
      prevTimeBar=T[0];
      //---
      for(int i=ArraySize(n)-1; i>=0; i--)
         sumprev[i]=integral[i].y;
      //---
      for(int obj=ObjectsTotal(0,0,-1)-1;obj>=0;obj--)
        {
         string obj_name=ObjectName(0,obj,0,OBJ_TREND);
         datetime obj_time=(datetime)ObjectGetInteger(0,obj_name,OBJPROP_TIME);
         if(obj_time<T[0]-DEL*PeriodSeconds())
            ObjectDelete(0,obj_name);
        }
      Comment("Emission © DC2008   Graphical objects = ",ObjectsTotal(0,0,-1));
     }
//--- calculation of integral characteristics of emission
   for(int i=ArraySize(n)-1; i>=0; i--)
      integral[i]=tsMA[i].Read();
//--- displaying integral characteristics of emission
   ArrayInitialize(W,5);
   if(integral[0].n>integral[1].n)
     {
      W[0]=20;
      W[1]=10;
     }
   else
     {
      W[0]=10;
      W[1]=20;
     }
   for(int i=ArraySize(n)-1; i>=0; i--)
     {
      //--- horizontal lines of mean prices
      name="H.line."+(string)i;
      ObjectCreate(0,name,OBJ_HLINE,0,0,0,0);
      ObjectSetInteger(0,name,OBJPROP_COLOR,colorLine[i]);
      ObjectSetInteger(0,name,OBJPROP_STYLE,STYLE_DASHDOT);
      ObjectSetInteger(0,name,OBJPROP_WIDTH,1);
      ObjectSetDouble(0,name,OBJPROP_PRICE,integral[i].y);
      //--- markers
      name="P."+(string)i;
      ObjectCreate(0,name,OBJ_TEXT,0,0,0);
      ObjectSetString(0,name,OBJPROP_FONT,"Wingdings");
      ObjectSetInteger(0,name,OBJPROP_ANCHOR,ANCHOR_CENTER);
      ObjectSetInteger(0,name,OBJPROP_FONTSIZE,fontMarker[i]);
      ObjectSetString(0,name,OBJPROP_TEXT,CharToString(163));
      ObjectSetInteger(0,name,OBJPROP_COLOR,colorLine[i]);
      ObjectSetDouble(0,name,OBJPROP_PRICE,integral[i].y);
      ObjectSetInteger(0,name,OBJPROP_TIME,integral[i].t);
      //--- integral curves
      name="T"+(string)i+".line"+(string)T[1];
      ObjectCreate(0,name,OBJ_TREND,0,0,0);
      ObjectSetInteger(0,name,OBJPROP_COLOR,colorLine[i]);
      ObjectSetInteger(0,name,OBJPROP_WIDTH,W[i]);
      if(sumprev[i]>0)
        {
         ObjectSetDouble(0,name,OBJPROP_PRICE,0,sumprev[i]);
         ObjectSetInteger(0,name,OBJPROP_TIME,0,T[1]);
         ObjectSetDouble(0,name,OBJPROP_PRICE,1,integral[i].y);
         ObjectSetInteger(0,name,OBJPROP_TIME,1,T[0]);
        }
      //--- numerical values of integral characteristics
      if(integral[0].n+integral[1].n>0)
        {
         name="Text"+(string)i+".control";
         ObjectCreate(0,name,OBJ_TEXT,0,0,0);
         ObjectSetInteger(0,name,OBJPROP_ANCHOR,ANCHOR_LEFT_LOWER);
         ObjectSetInteger(0,name,OBJPROP_FONTSIZE,fontPoint[i]);
         ObjectSetInteger(0,name,OBJPROP_COLOR,colorLine[i]);
         string str=DoubleToString((double)integral[i].n/(double)(integral[0].n+integral[1].n)*100,1);
         ObjectSetString(0,name,OBJPROP_TEXT,str);
         ObjectSetDouble(0,name,OBJPROP_PRICE,0,integral[i].y);
         ObjectSetInteger(0,name,OBJPROP_TIME,0,integral[i].t);
        }
     }
  }
代码变短了,而计算速度却提高了。现在,您可以测试和优化您的交易机器人了,且无需可视化!
整体特征在交易中的使用
整体特征可被用作一种信号生成器,以求:
- 通道突破,
- 彼此或与价格交叉,
- 改变方向。
比如说,下图所示即为喷发的整体特征用于同价格交叉的假想。当价格向上穿过蓝色曲线时,即生成卖出信号;而当向下穿过浅绿色曲线时,则生成买入信号。
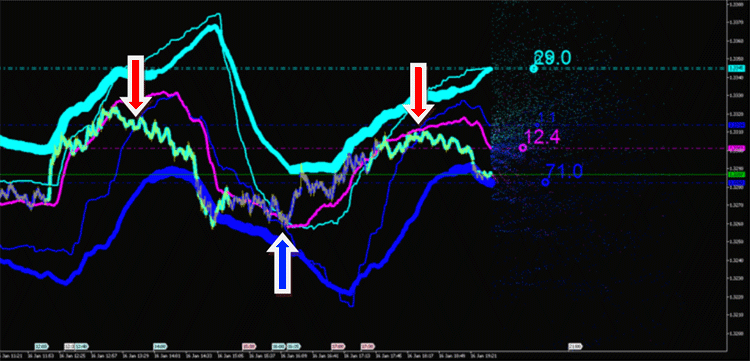
图 11. 喷发整体特征交叉点的交易信号
总结
- 指标喷发整体特征的计算,为市场分析(时间序列)提供了新工具、新方法。
- 利用时间序列,我们已经实现了整体特征计算的速度提高。
- 而且,它已经为我们打开了使用喷发的自动化交易策略开发的大门。
本文译自 MetaQuotes Software Corp. 撰写的俄文原文
原文地址: https://www.mql5.com/ru/articles/610
MyFxtop迈投(www.myfxtop.com)-靠谱的外汇跟单社区,免费跟随高手做交易!
免责声明:本文系转载自网络,如有侵犯,请联系我们立即删除,另:本文仅代表作者个人观点,与迈投财经无关。其原创性以及文中陈述文字和内容未经本站证实,对本文以及其中全部或者部分内容、文字的真实性、完整性、及时性本站不作任何保证或承诺,请读者仅作参考,并请自行核实相关内容。
著作权归作者所有。
商业转载请联系作者获得授权,非商业转载请注明出处。

 MyFxTops邁投財經
